![]()
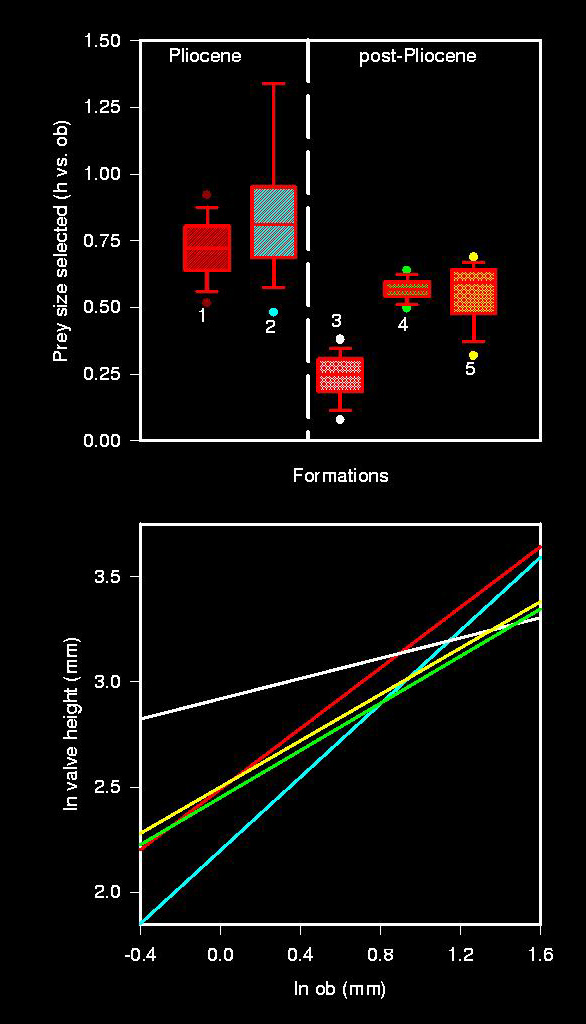
Figure 9. A) Intersample comparison of prey size selection. Each box represents the distribution of slopes for 1,000 bootstrap iterations of valve height (h) regressed on outer drill hole diameter (ob). Vertical dashed line marks the Plio-Pleistocene transition. Sample numbers are: 1 - Pinecrest Beds, 2 - Caloosahatchee Fm., 3 - Bermont Fm., 4 - Ft. Thompson Fm., and 5 - Recent. The samples differ statistically only among their regression slopes (intercepts are not statistically different), and fall into three statistically distinct groups: (1) The Pliocene Pinecrest Beds (h = (0.72ob)+2.49 [P < 0.001]) and Caloosahatchee Fm. (h = (0.87ob)+2.20 [P=0.005]), (2) the Lower Pleistocene Bermont Fm. (h = (0.24ob)+2.92 [P=0.001]) and (3) the Middle Pleistocene Ft. Thompson Fm. (h = (0.56ob)+2.45 [P=0.019]) and the Recent (h = (0.55ob)+2.50 [P < 0.001]). B) Plot of the regressions relationships summarized in (A). Colors follow those of the symbols in (A): red - Pinecrest Beds, cyan - Caloosahatchee Fm., white - Bermont Fm., yellow - Ft. Thompson Fm. and green - Recent. The figure demonstrates clearly the significant decrease in the stereotypy of prey size selectivity associated with the Plio-Pleistocene transition, followed by an increase during Ft. Thompson time.