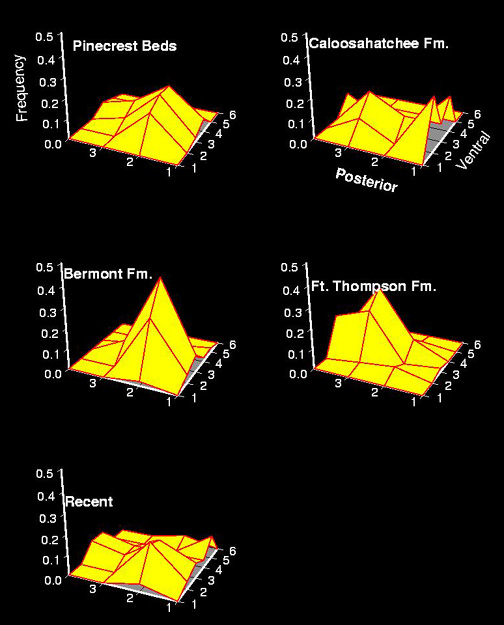
Figure 8. Distribution of drill holes on valve surfaces during each geological formation. The xy plane represents the grid illustrated in Figure 5. z axis represents the frequency of drilling per quadrat.