![]()
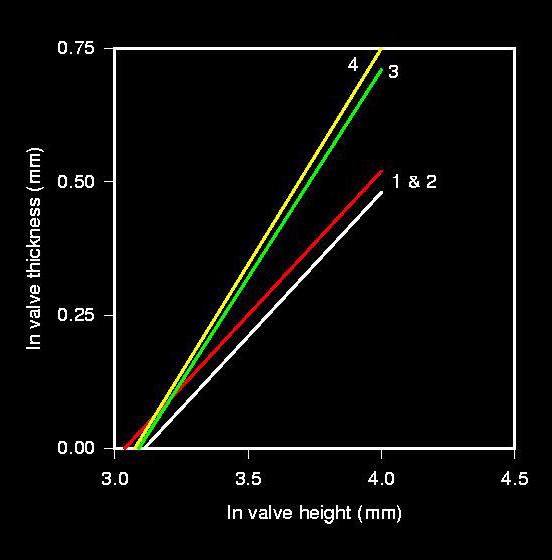
Figure 10. Valve thickness (t) regressed on valve height (h). Each line represents the median line of 1,000 bootstrap iterations. Sample numbers are: 1 - Pinecrest Beds, 2 - Bermont Fm., 3 - Ft. Thompson Fm., and 4 - Recent. The Caloosahatchee Fm. was excluded because of the lack of a significant regression (due possibly to an insufficient sample size). Lines 1 and 2 (t = (0.54h)-1.68 [P < 0.001] and t = (0.54h)-1.64 [P=0.007] respectively) are statistically indistinguishable, as are lines 3 and 4 (t = (0.78h)-2.41 [P < 0.001] and t = (0.81h)-2.49 [P < 0.001] respectively). Both pairs are however statistically distinct from each other, reflecting the significant increase of valve thickness from the Middle Pleistocene on. The lines were plotted to a valve height of 36mm, which is the approximate mean height of over 700 measured specimens of both C. erosa and C. cancellata (Roopnarine, 1996).