![]()
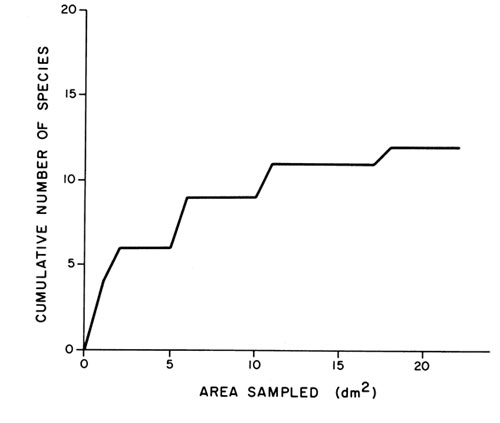
FIGURE 13. Species area curve for a randomly selected sequence of 22 grid squares (each amounting to one square decimeter, or 100 cm2) from the taphonomic map (Figure 8) for MNA locality 318.
|
|
FIGURE 13. Species area curve for a randomly selected sequence of 22 grid squares (each amounting to one square decimeter, or 100 cm2) from the taphonomic map (Figure 8) for MNA locality 318.
|