![]()
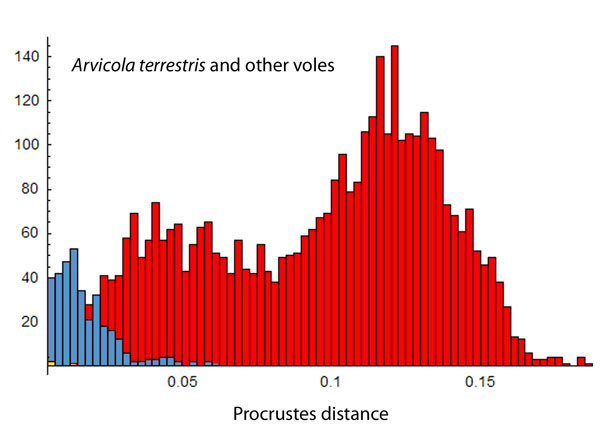
FIGURE 7. Comparison of the magnitude of between-side, between-individual, and between-species differences in lower molar shape. Histograms show the frequency of between-side distances (yellow bars), between-individual distances within Arvicola terrestris (blue bars), and between individual distances for individuals belonging to different species (red bars). The red histogram may be visually compared with the histograms for the other three species in Figure 5.