![]()
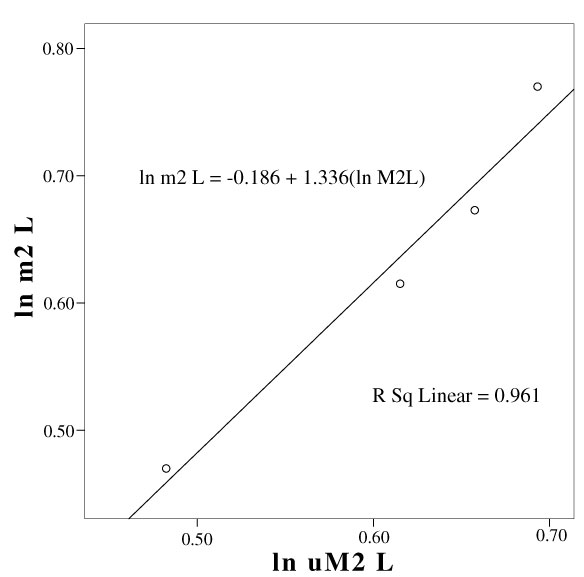
FIGURE 7. Scatter plot with regression model of ln lower m2 length versus ln upper M2 length using associated dentitions of Asian Cretaceous mammals.
|
|
FIGURE 7. Scatter plot with regression model of ln lower m2 length versus ln upper M2 length using associated dentitions of Asian Cretaceous mammals.
|