![]()
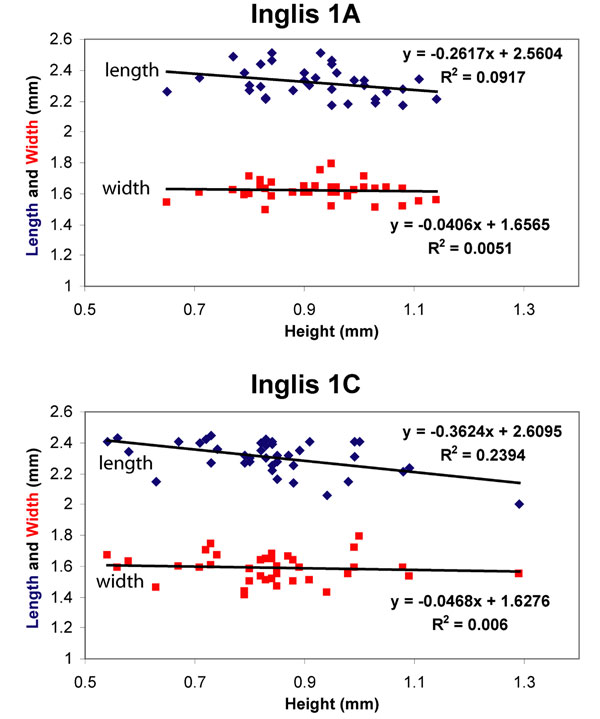
FIGURE 5. Bivariate plot of length and width against height of m1. Lengths are marked as diamonds; squares are widths.
|
|
FIGURE 5. Bivariate plot of length and width against height of m1. Lengths are marked as diamonds; squares are widths.
|